|
All 5 books, Edward Tufte paperback $180
All 5 clothbound books, autographed by ET $280
Visual Display of Quantitative Information
Envisioning Information
Visual Explanations
Beautiful Evidence
Seeing With Fresh Eyes
catalog + shopping cart
|
Edward Tufte e-books Immediate download to any computer: Visual and Statistical Thinking $5
The Cognitive Style of Powerpoint $5
Seeing Around + Feynman Diagrams $5
Data Analysis for Politics and Policy $9
catalog + shopping cart
New ET Book
Seeing with Fresh Eyes:
catalog + shopping cart
Meaning, Space, Data, Truth |
Analyzing/Presenting Data/Information All 5 books + 4-hour ET online video course, keyed to the 5 books. |


Megan Jaegerman produced some of the best news graphics ever while working
at The New York Times from 1990 to 1998. Her work is smart, finely detailed,
elegant, witty, inventive, informative. A fierce researcher and reporter, she writes
gracefully and precisely. Megan has the soul of a news reporter, who happens
to use graphs, tables, and illustrations--as well as words--to explain the news.
Her best work is the best work in news graphics.
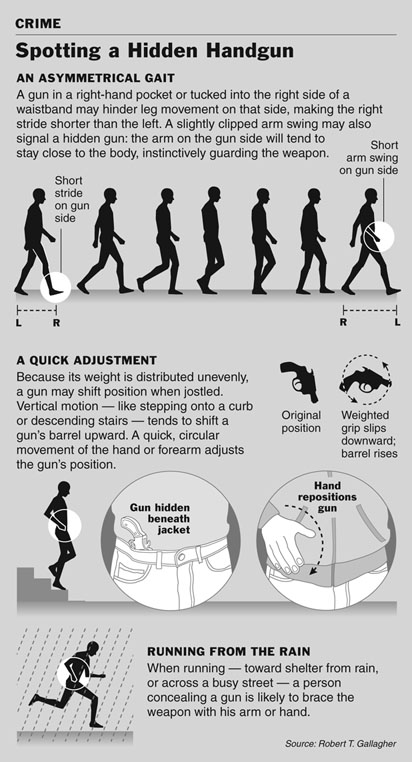
In 2004-2005, she revised one of her Times news graphics for my book
Beautiful Evidence (pages 116-117), shown below. The revision includes
several private jokes: images of E. J. Marey (from BE), Kenneth Noland
(from Mark Tansey's The Myth of Depth in Visual Explanations), ET in
the sculpture studio, and a friend of Megan's--somehow the four of us have
unfortunately become involved with handguns. This work took months;
for example, Megan and I exchanged many emails and 3 redesigns figuring
out whether the stoplight should be red, green, or yellow.
Color is used to highlight how the gun moves and how the gun reveals itself,
short visual noun-verb sentences that indicate the key signs that help detectives
to spot someone carrying a hidden handgun. Thus the color usually has a
distinct substantive point and is not just used to depict surfaces or to decorate
the news.
Most of all, the content is really interesting; we learn something new from Megan
Jaegerman's fine reporting work. Details of the reporting are discussed in the text
immediately below the graphic.
 |
Here is my text from Beautiful Evidence analyzing the graphic:
 |
Below, Megan's original handgun graphic from The New York Times, May 26, 1992:
 |
Here are more of her greatest hits:
 |
 |
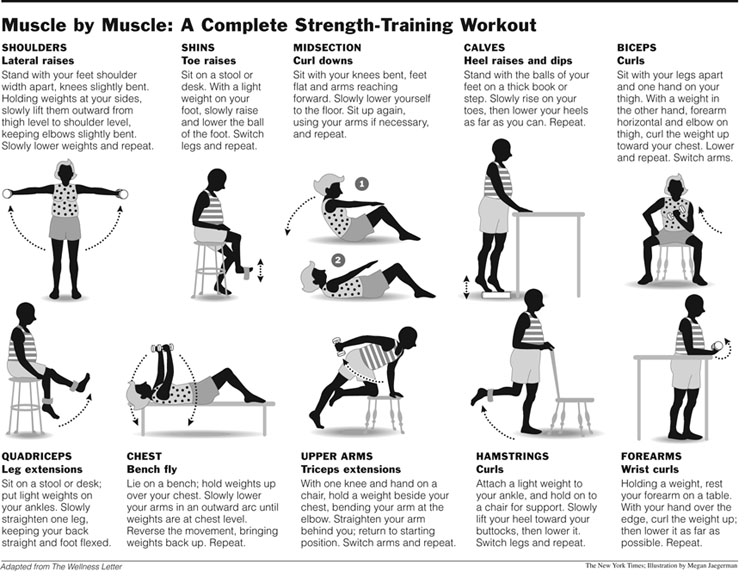
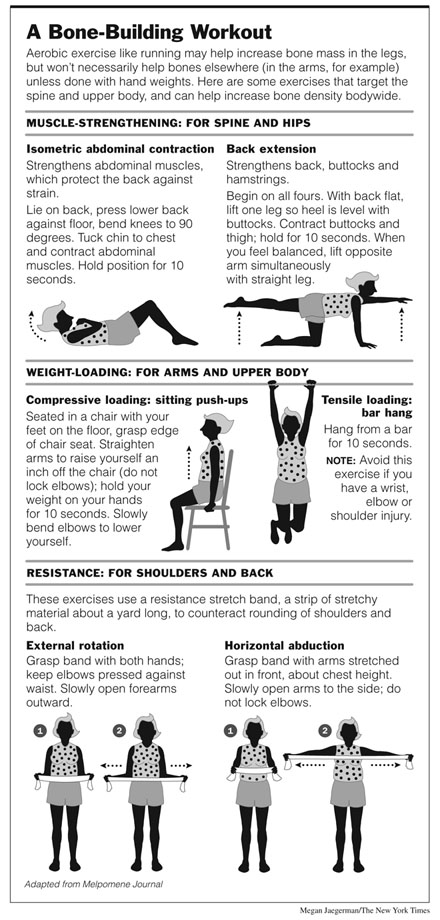
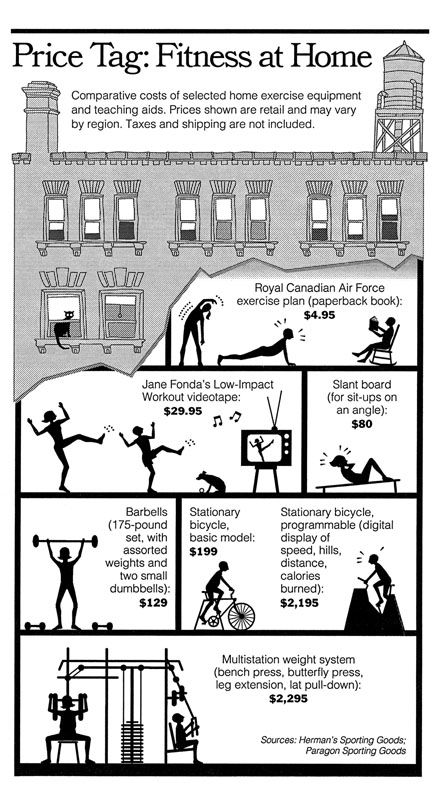
Below, Megan's classic instructions for basic exercises became
widespread refrigerator-door art in New York City (according
to an editor at the Times).
 |
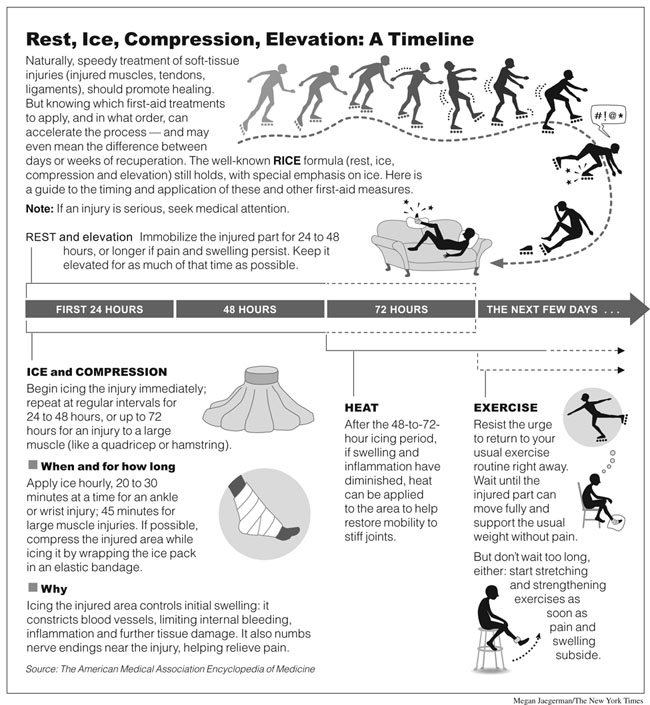 |
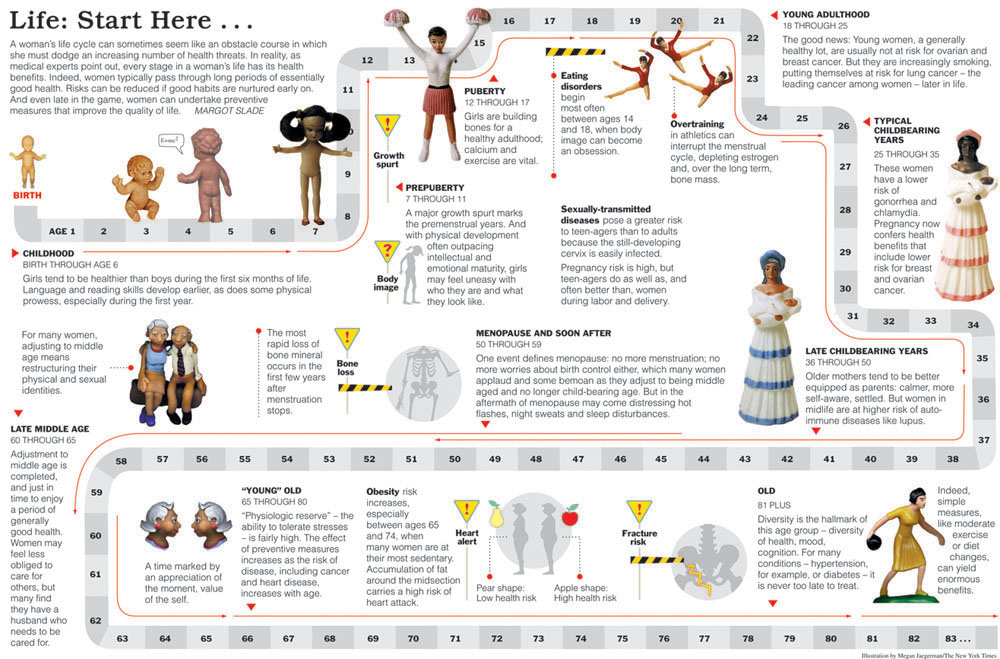
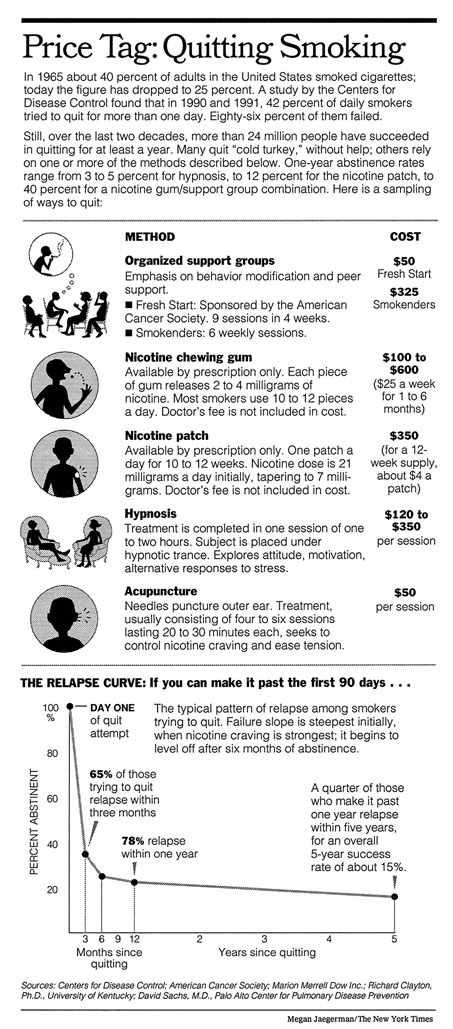
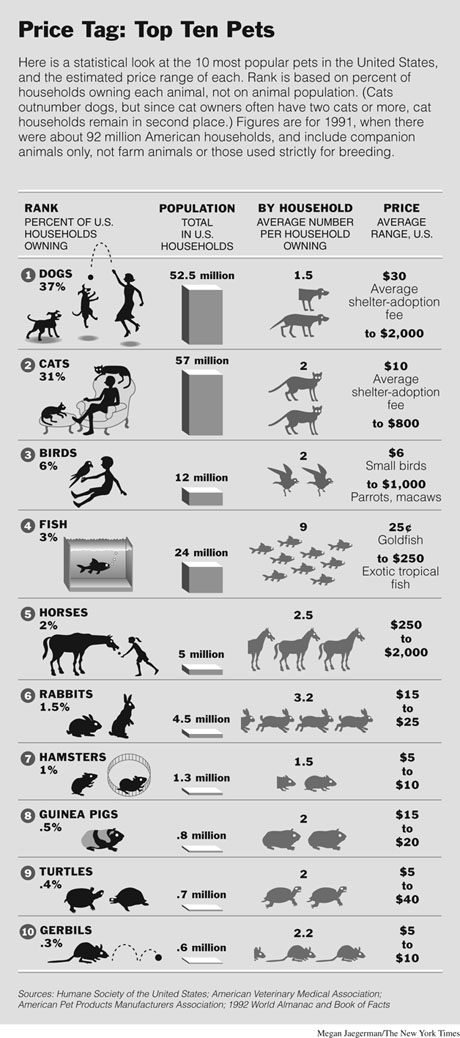
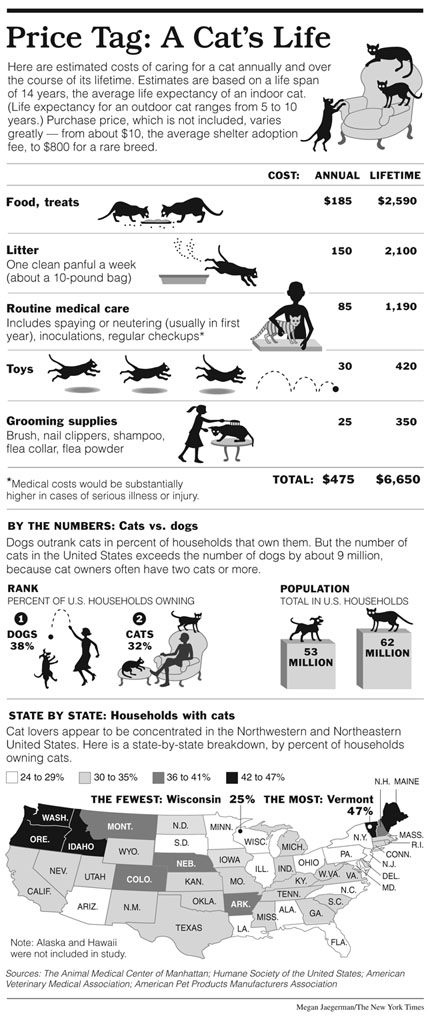
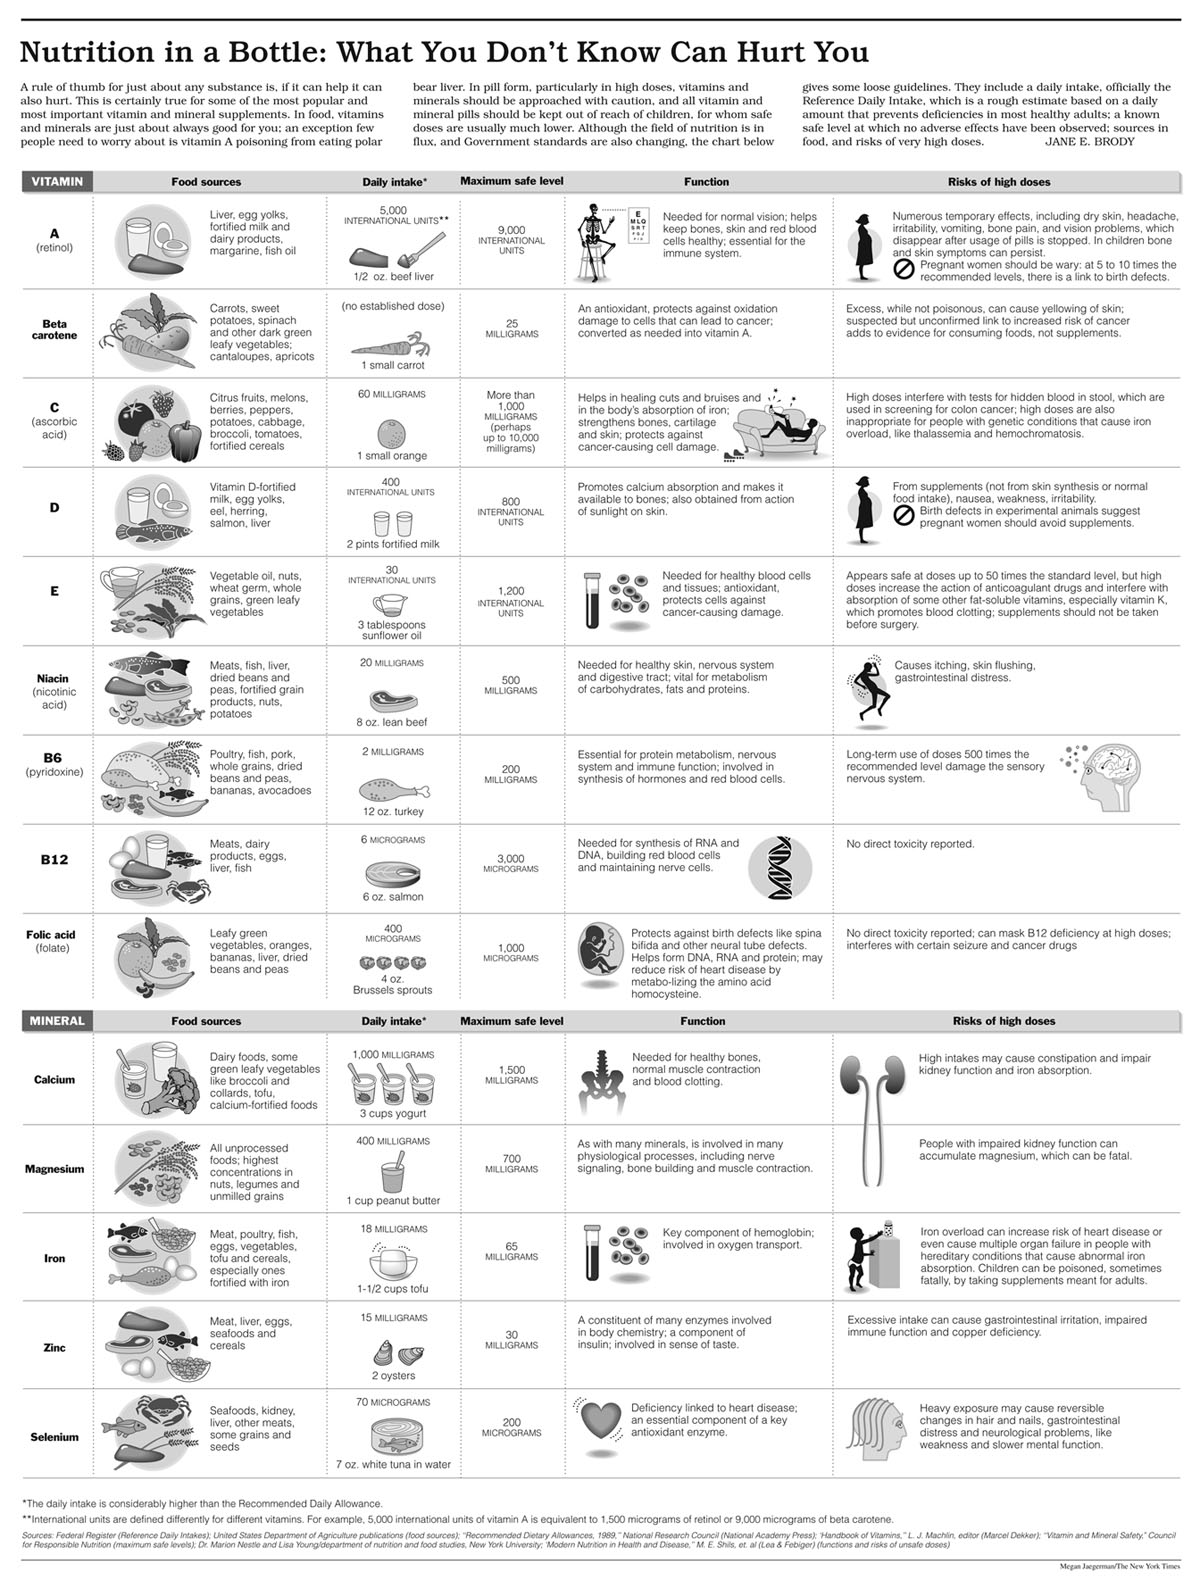
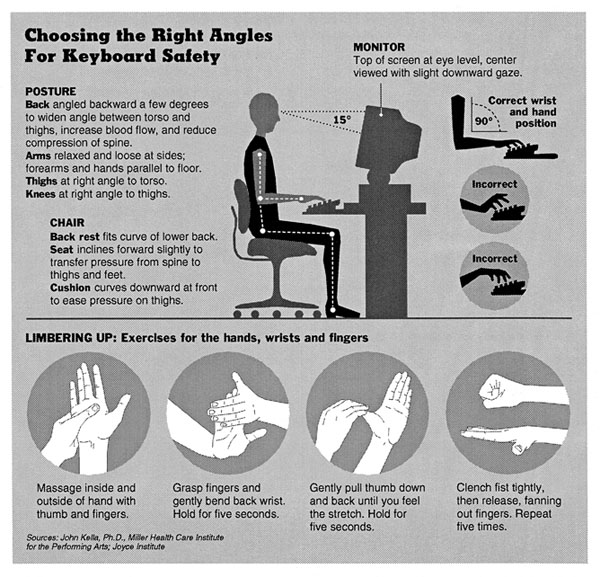
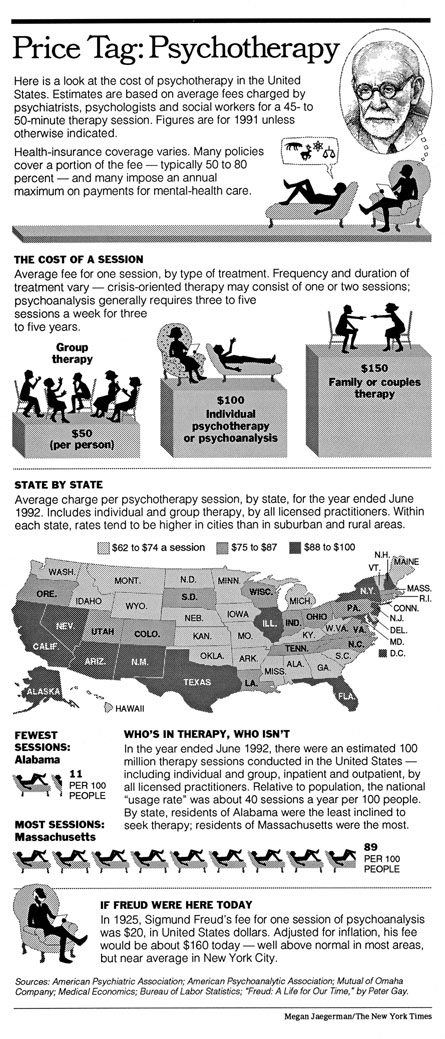
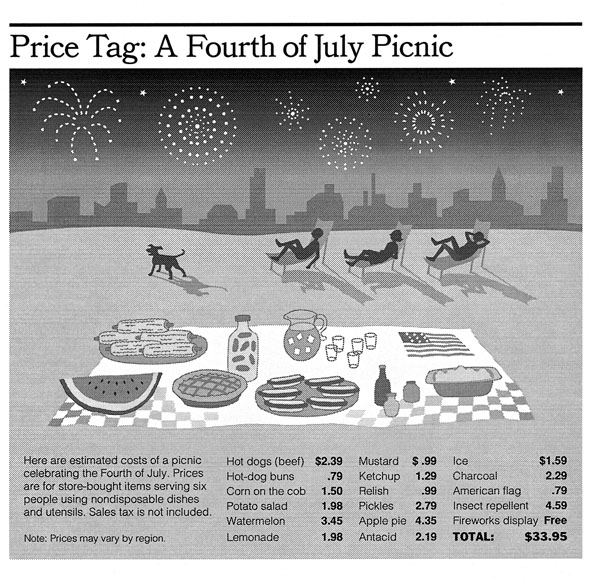
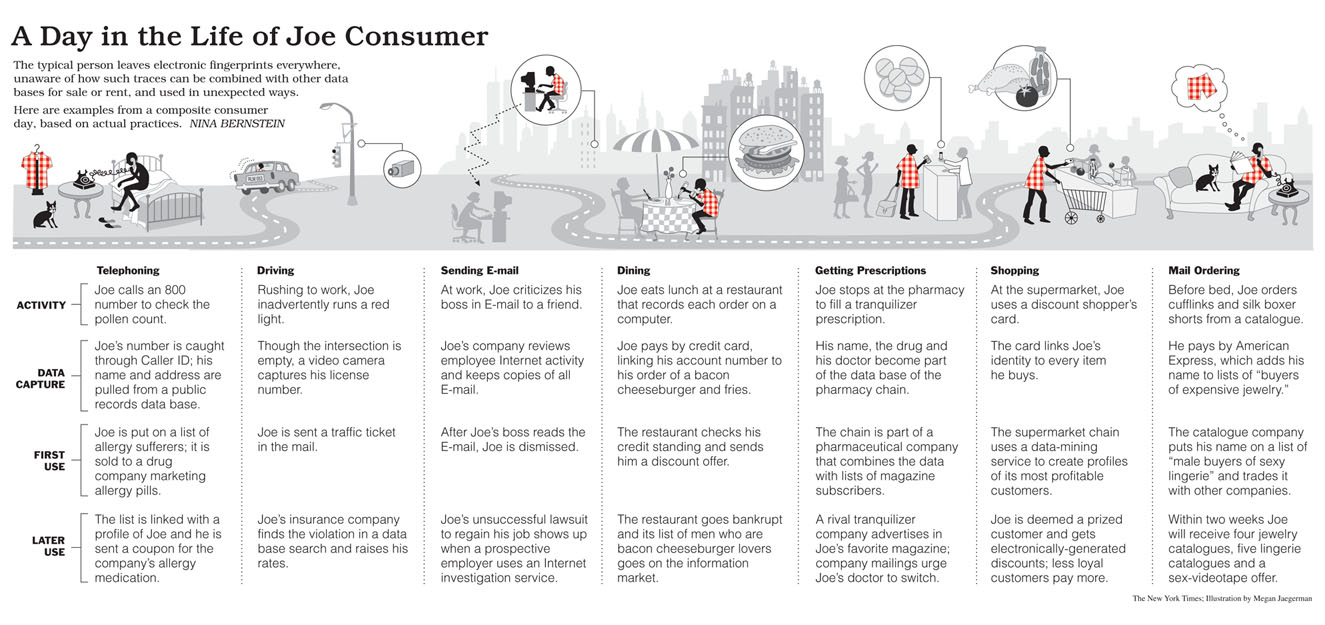
The next 2 displays below beautifully combine tables, images, text--whatever
it takes to explain the content. Megan Jaegerman's work has consistently this spirit:
content-driven, no segregation of information by its mode of production, whatever
it takes to explain something.
In this graphic below on quitting smoking, the data graph at the bottom showing
the relapse/time curve is a fine touch, a reminder of the temperature/time graph in
Minard's French Invasion of Russia in 1812.
 |
 |
 |
-- Edward Tufte
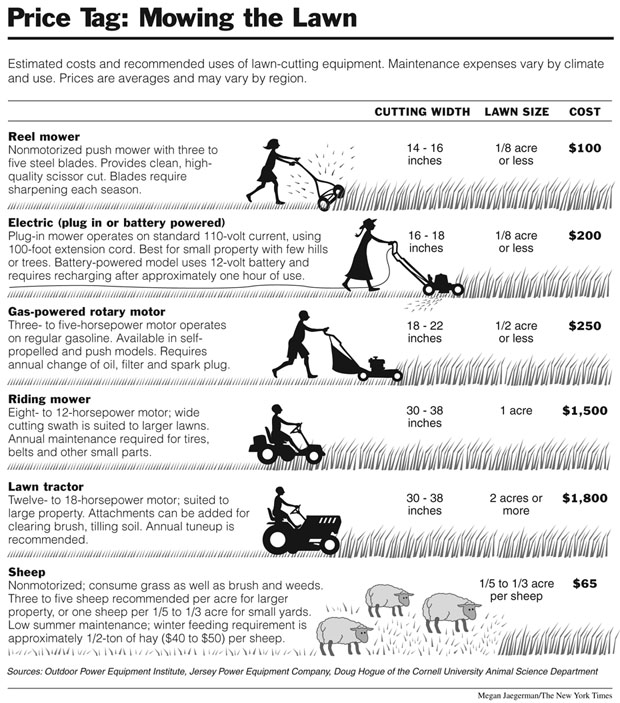
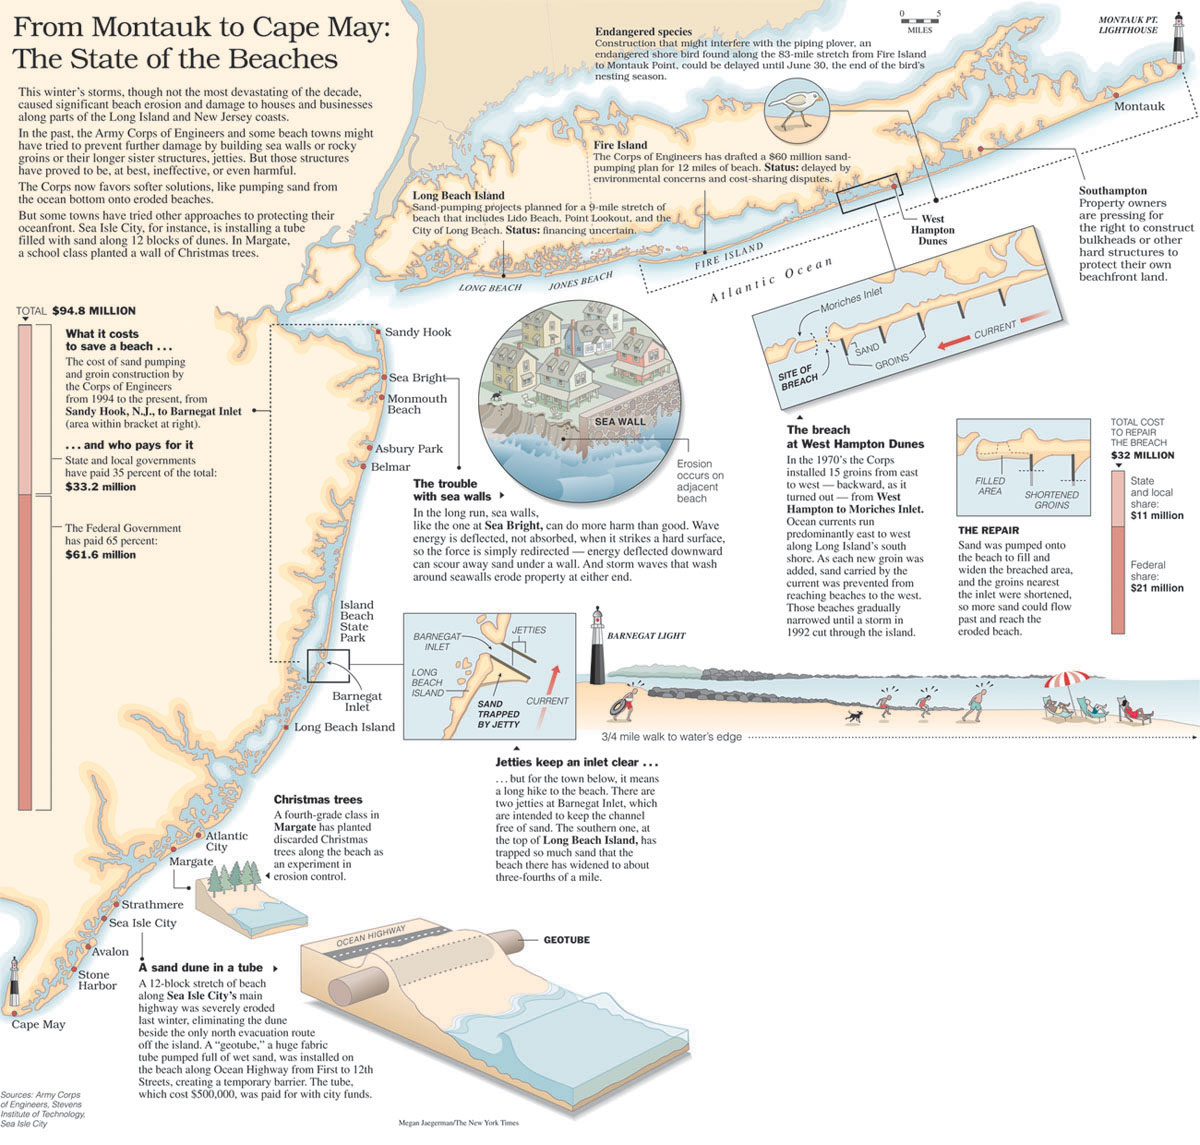
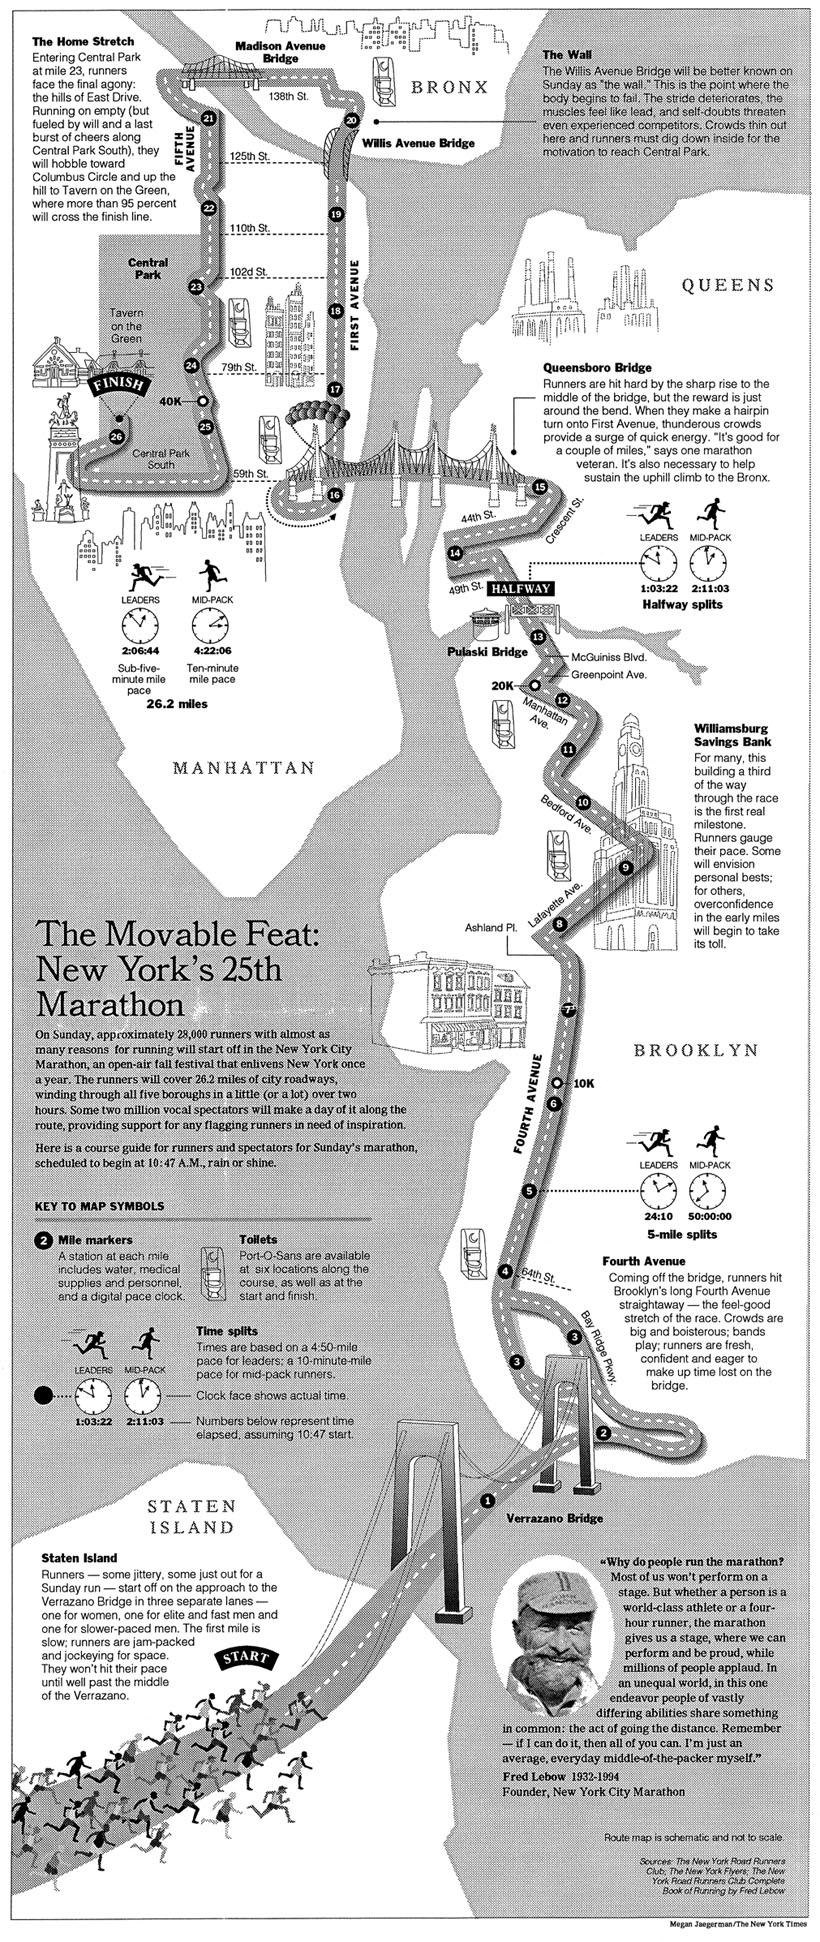
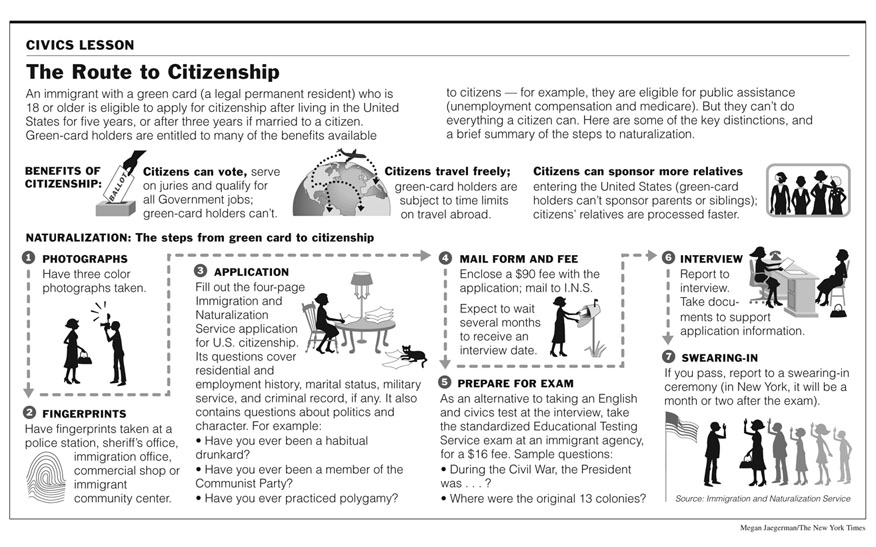
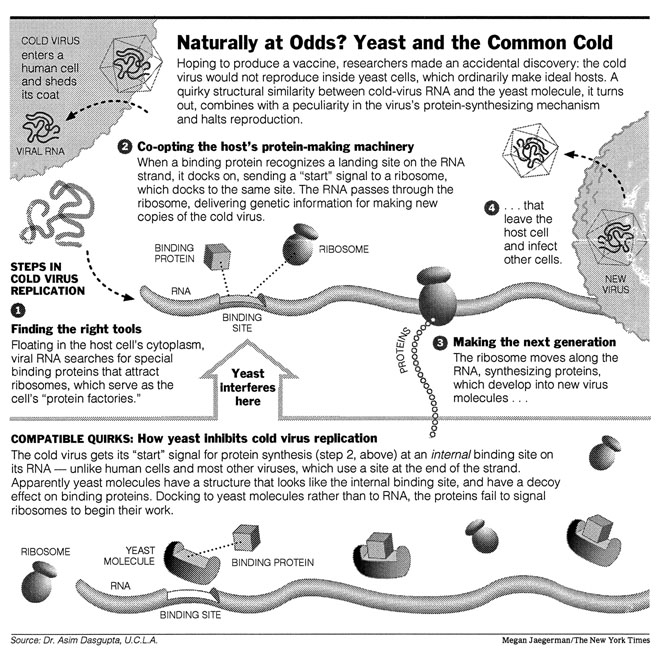
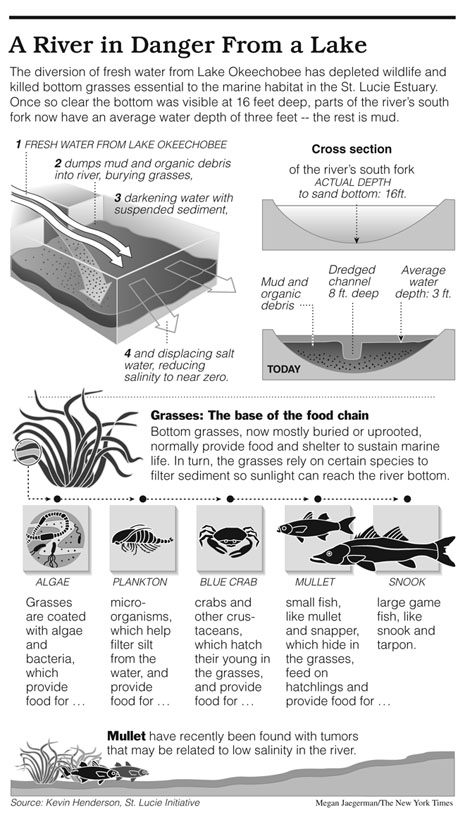
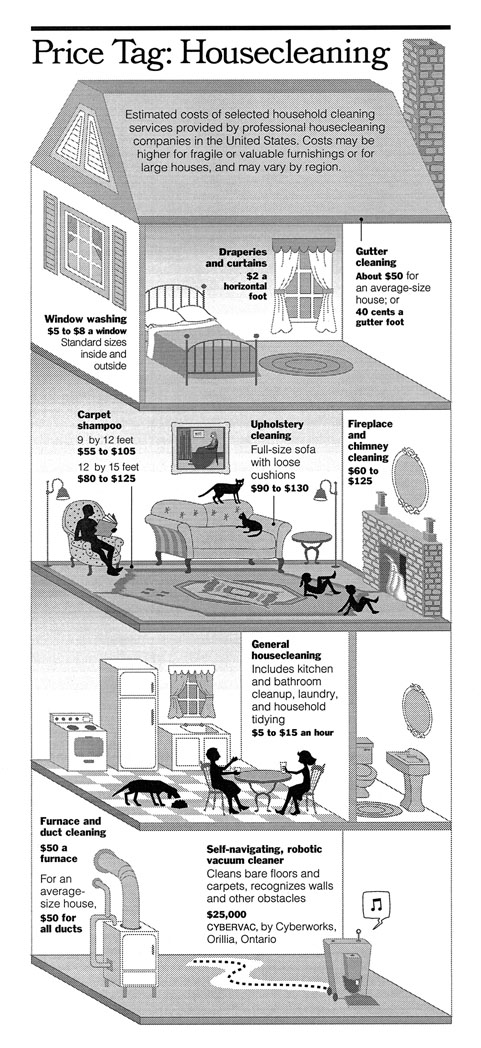
A wonderfully contextual field guide below. Most fields guides isolate each animal or
plant; here many animals and plants are placed in their natural context along with the
fully integrated explanatory text:
 |
-- Edward Tufte
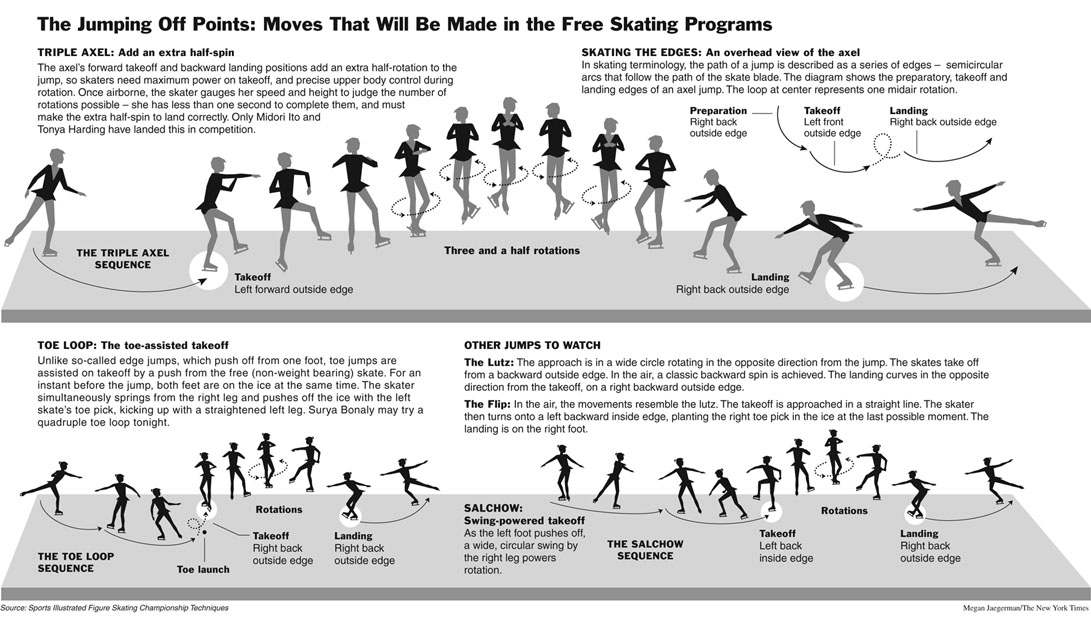
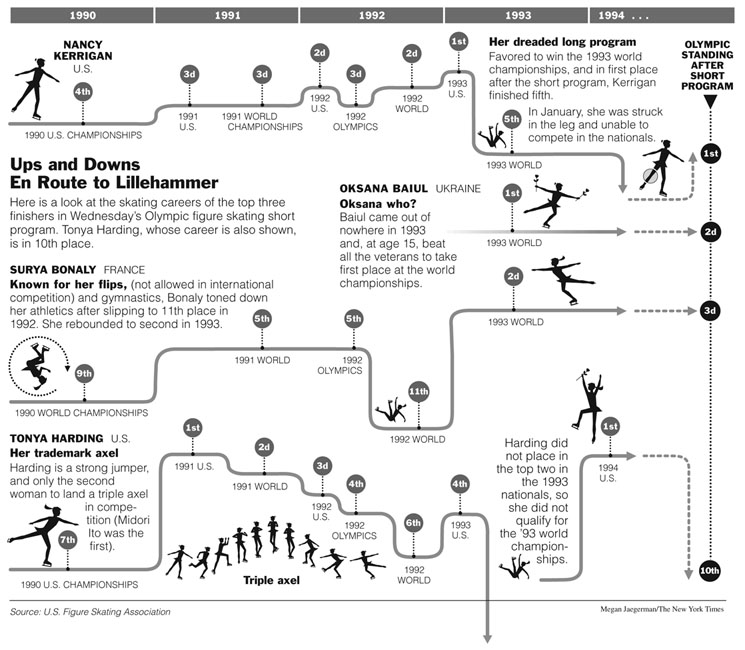
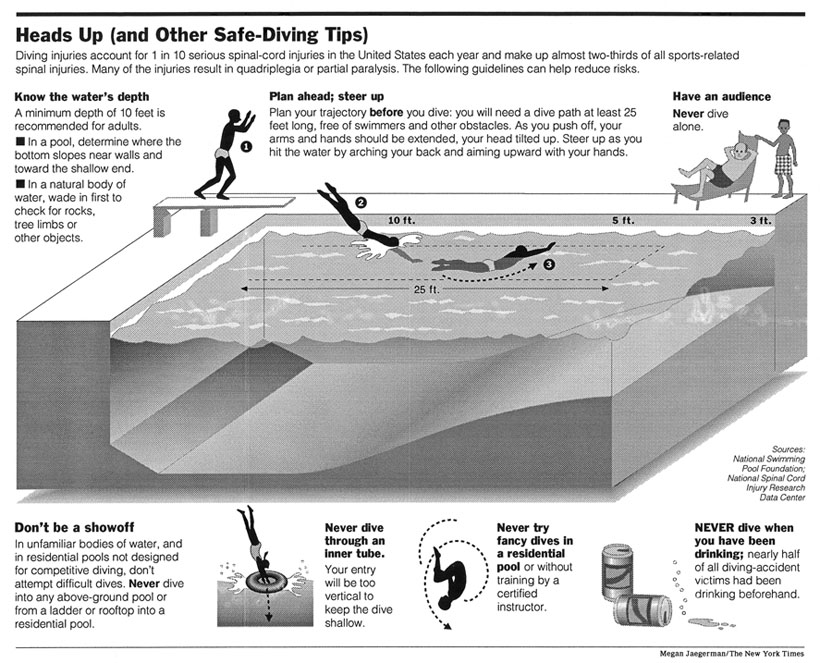
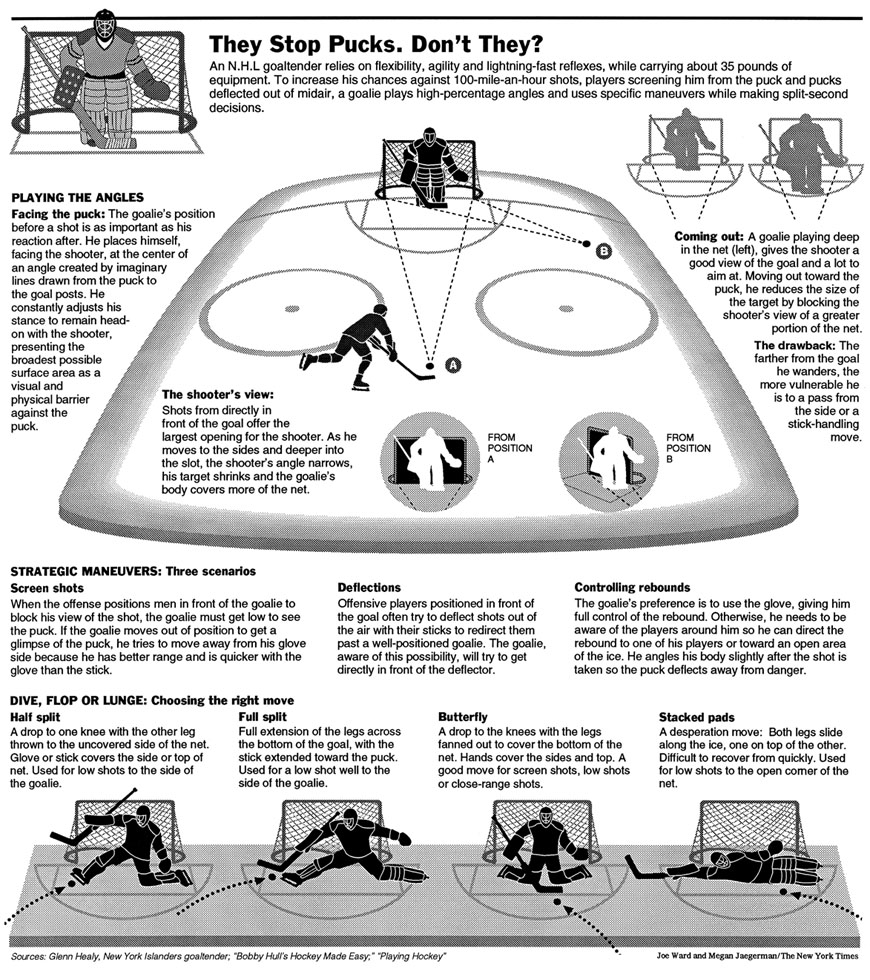
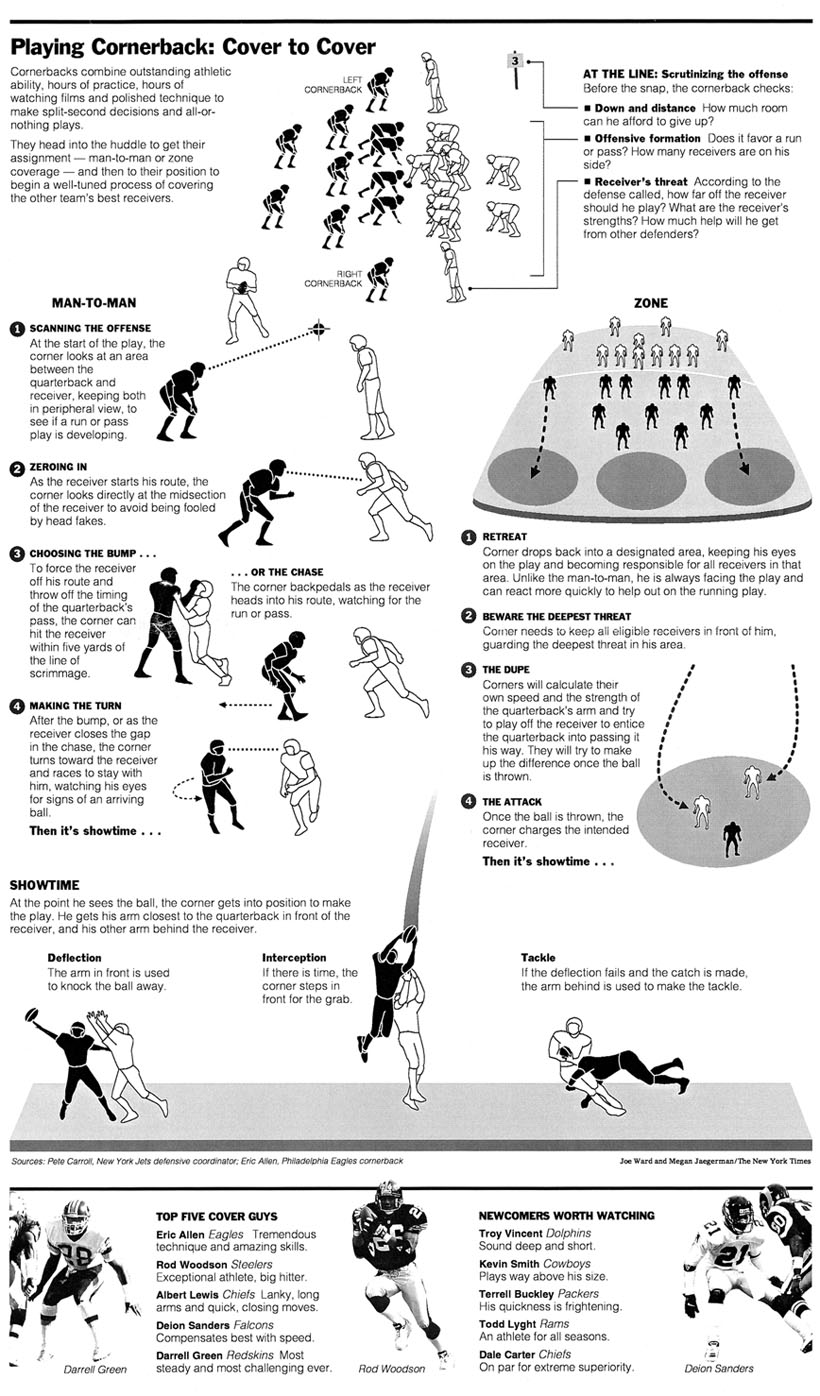
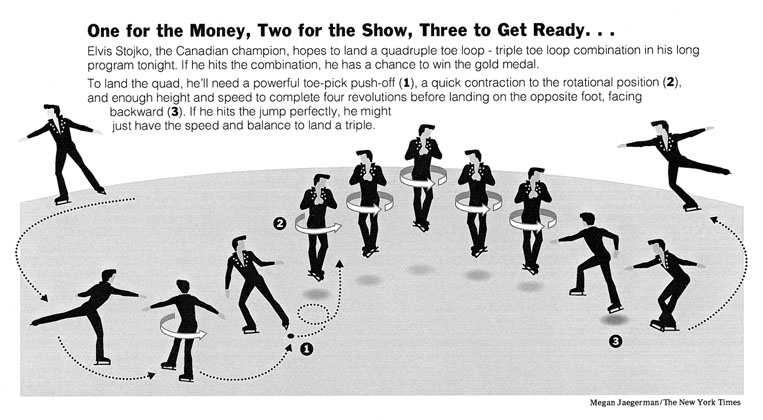
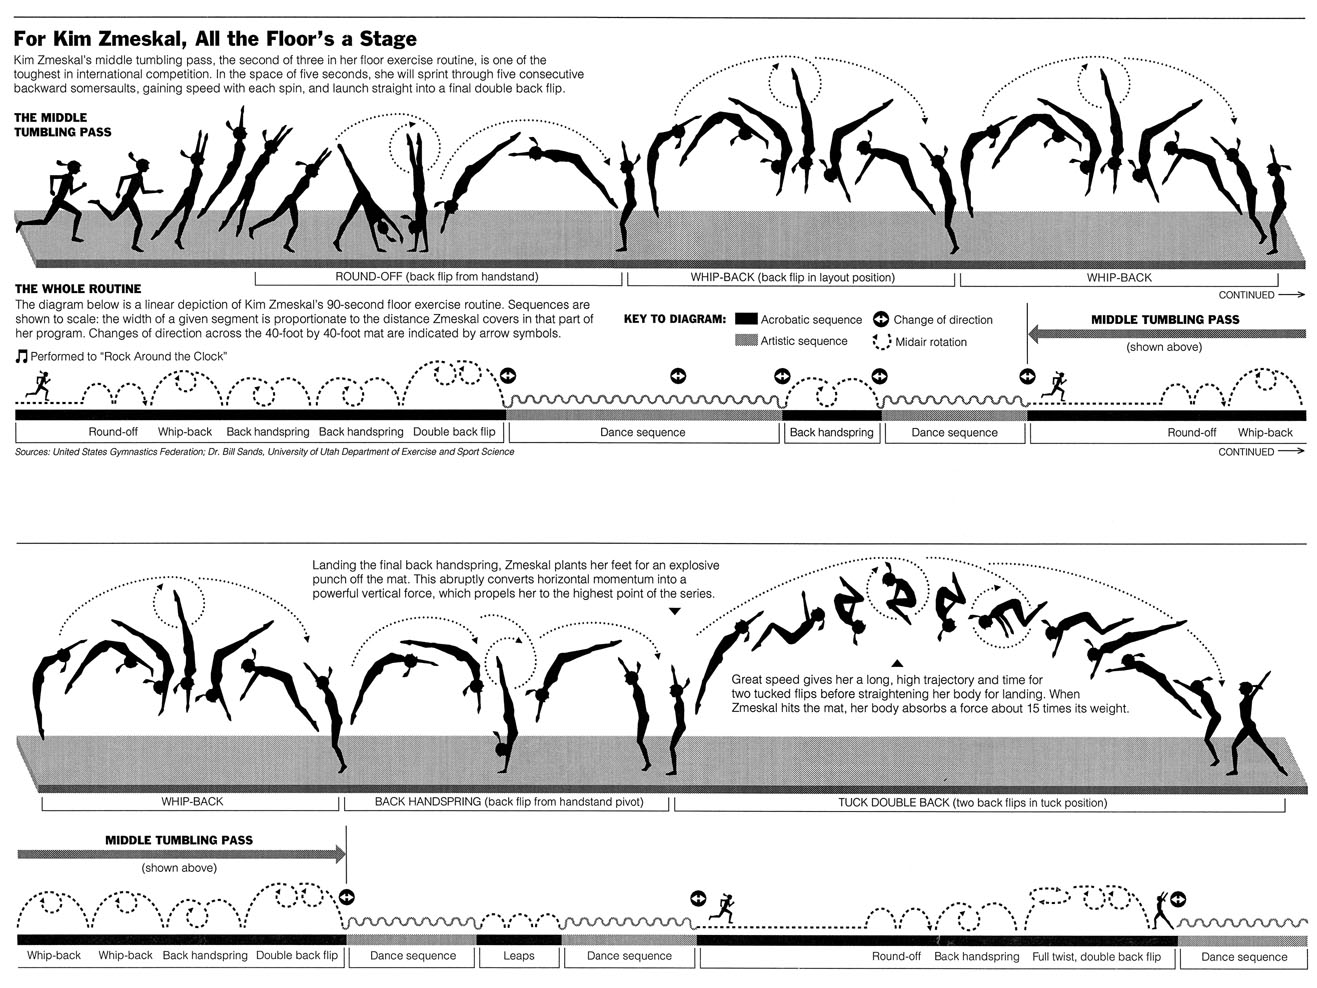
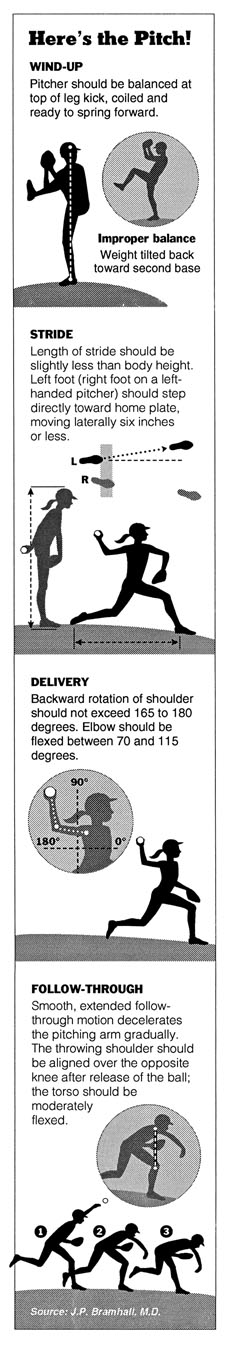
Below, a collection of sports news graphics by Megan Jaegerman:
 |
 |
 |
 |
 |
 |
 |
-- Edward Tufte
 |
 |
 |
-- Edward Tufte
I was delighted to see the brilliant news graphics of Megan Jaegerman. Her elegant, clever and detailed work in news graphics is the best I ever seen. I miss her illustrations in the Times and wonder where I might see her current work.
-- karen collins (email)
 |
 |
 |
 |
-- Edward Tufte
 |
 |
 |
 |
-- Edward Tufte
 |
 |
 |
 |
-- Edward Tufte
 |
 |
 |
 |
-- Edward Tufte
Extraordinary! The ultimate evolution from the "show and tell" of grammar school days.
I would like to know more about Megan's philosophy, guiding principles, work processes, quality criteria, creative time required and reader feedback, etc. Perhaps we need a book by Megan?
-- Loren R. Needles (email)
|
||||||