Original Question
Election data displays
Easily the best map (because of its notable content):
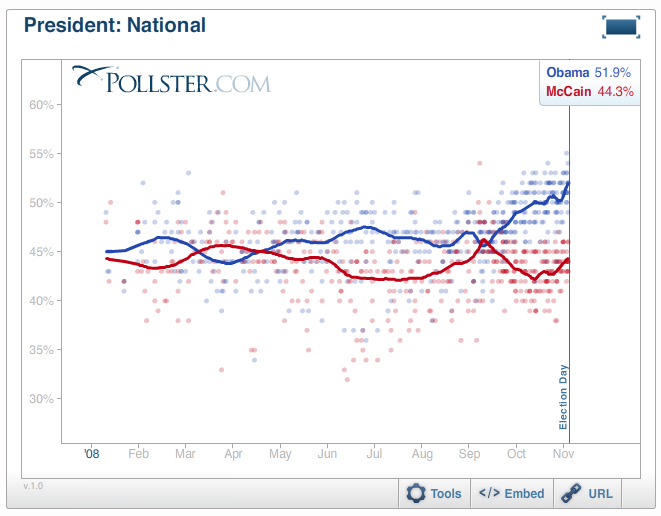
Excellent reporting of pre-election polls: Pollster.com graphics and tables. Run by first-rate scholars of surveys, pollster.com provided individual survey results in a long-run context, which reduces the tendency for partisans and news reporters to go crazy with every little daily random bounce. The main bias of the media is hyped news, which too rapidly discounts olds, context, stability, and trends moving at a weekly or monthly pace. Below, pollster.com graphics for some 550 presidential election polls for all of 2008, along with summary smoothing lines. Particularly helpful is the visual comparison of all the polls each day on the vertical alignment. Also each new daily addition to the graphic (during the course of the campaign) locates that day in relation to all previous daily polls in the campaign. This graphic provides both overview and detail; in well-designed data displays, there does not have to be a trade-off between a quick-read overview and some detailed data showing the pieces going into the overview. Notice how the stronger colors of the smoothed path are cleanly separated from the lighter daily dots from each poll. Also interesting is the increase in the number of daily polls during 2009.
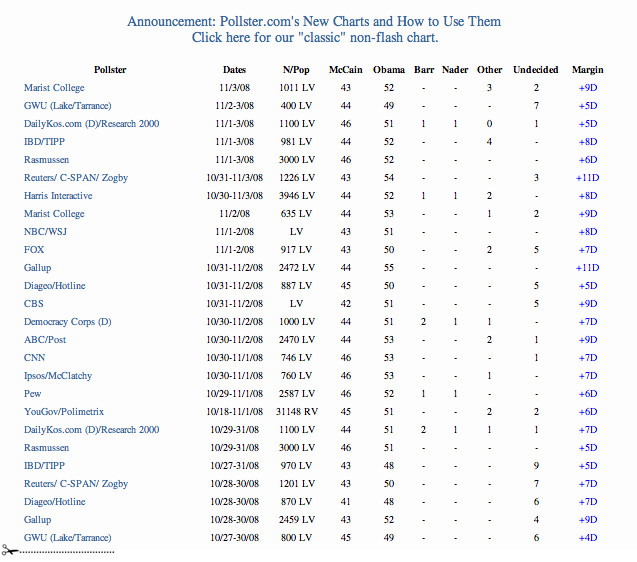
Below, here's a part of accompanying database table, and so on through all 550 surveys:
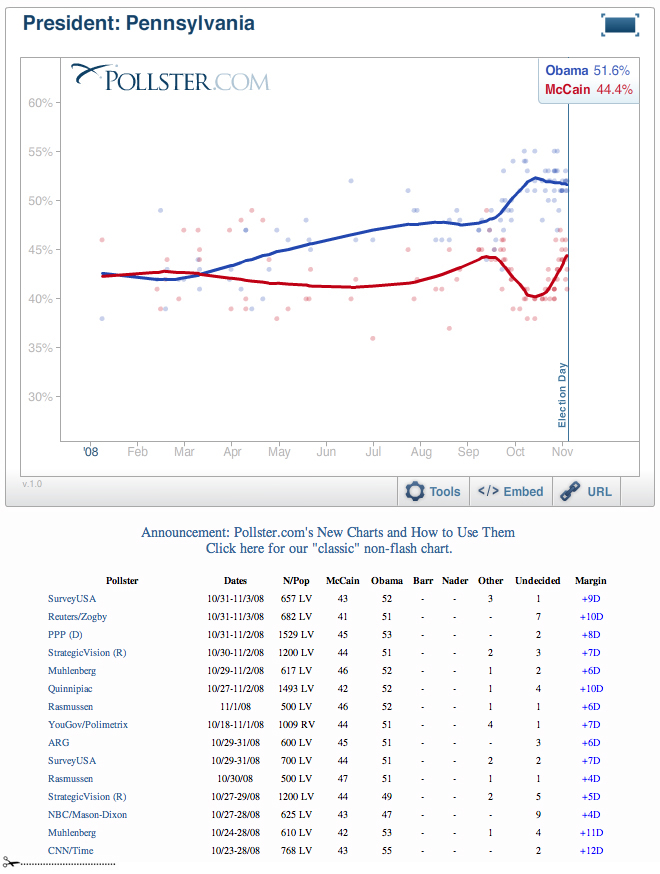
The above graphics and tables serve well as models for reporting quantitative evidence in government and business (who might well ask "why aren't our evidence displays up to pollster.com? And why are we still using PowerPoint templates for data presentations?") The success of pollster.com on the internet indicates that these displays have met a market and usability test: millions of visitors have come to appreciate intense data presentations that combine both overview and detail. Below, pollster.com's display for a state:
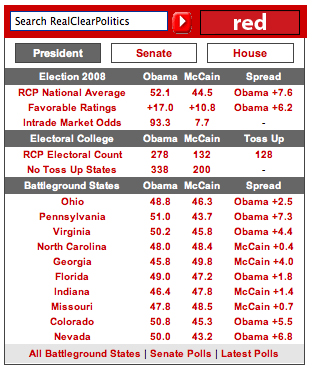
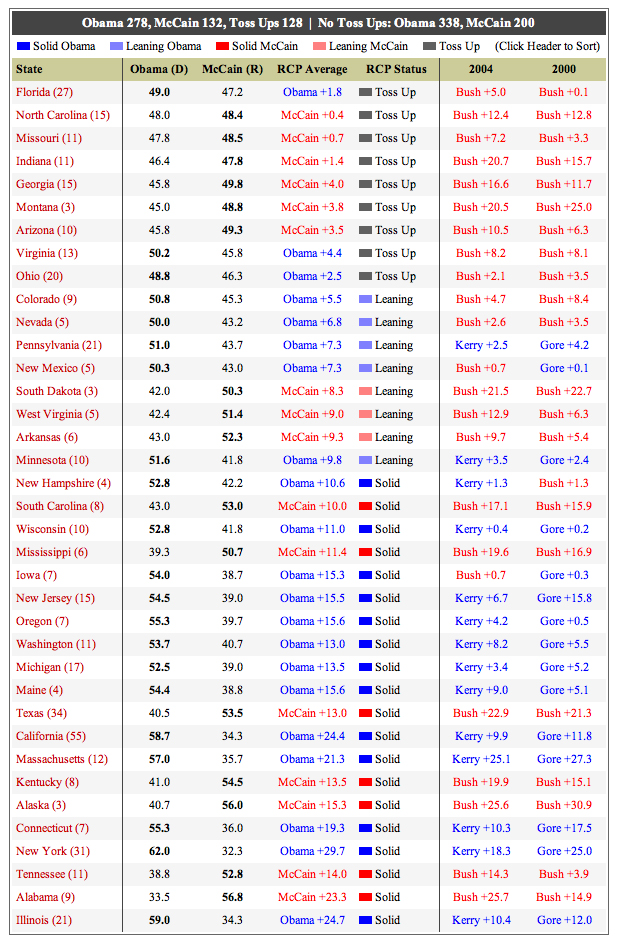
Real Clear Politics provided a well-designed summary table showing the immediate polls, betting, and electoral college distributions. Most of the mainstream media relied on this table for polling coverage. RCP's Jay Cost of wrote several thoughtful pieces puzzling over polling data. And pollster.com produced many high-level and deeply informed discussions of polling methodology. My conclusion: journalists should have relied on both pollster.com and RCP. Here are some good tables and graphics from RCP on election day:
Below, a beautiful table from RCP:
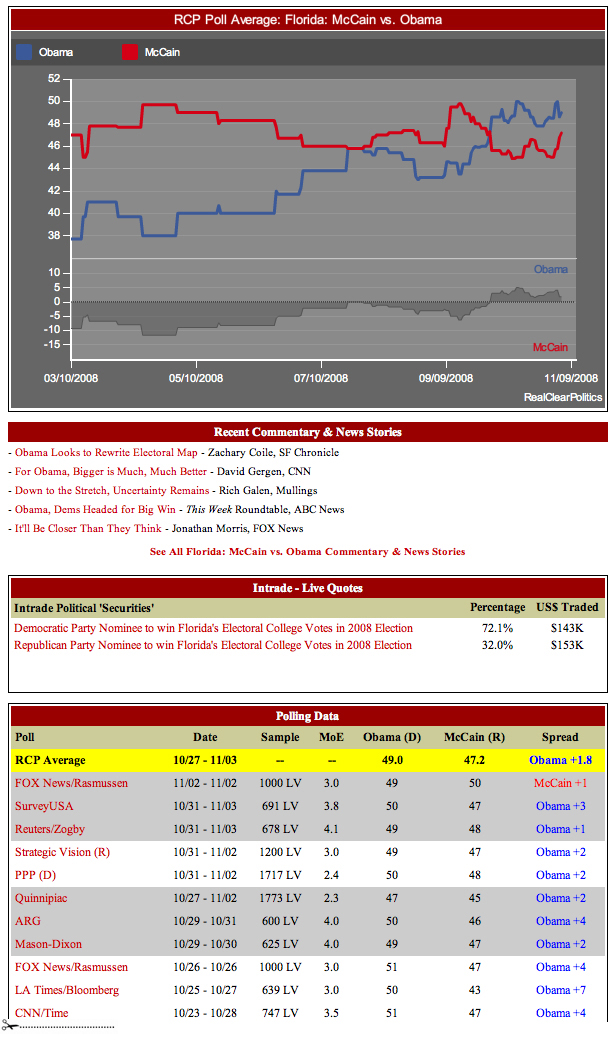
Here's RCP on Florida; note the betting data:
All these screen dumps were collected around 2.00pm on election day, November 4, 2008. I should have also picked up the excellent displays of fivethirtyeight.com as well. -- Edward Tufte
Your contribution to the forum This board is only about evidence presentations and analytical design. For all business matters (book orders, courses, shipping, prices, delivery dates), please go to the Graphics Press contact information on our home page On the Ask ET forum, we seek to publish questions and contributions that advance the analytical content of the thread, provide a good example, or raise an interesting question. Contributions should be relevant to the chosen thread. Please no marketing pitches, gratuitous links, or incivilities. There are about 6,000 contributions in the 500 threads now published on this board; they provide good examples of what has been accepted for publication. Some new contributions go to a non-public queue, which is frequently reviewed by a member of the editorial board in order to decide whether the material should be posted. About 30% of submitted contributions are posted; after publication, about half survive the occasional reviews of published items. The editors are unable to reconsider their decisions or to answer any queries about editorial decisions (some of which may well be mistaken). Publication policies are described in detail at Moderating internet forums If your contribution is published, your email address will be masked on the board, and your identifying IP number will not be published. Thank you.
|
|||||||||