Overlapping data graphics to make comparisons
Here are displays of performances of 10 large mutual funds, first a sparkline-table, and then by various overlaps or stacked piles of sparklines:

Source: Edward Tufte, Beautiful Evidence, p.51
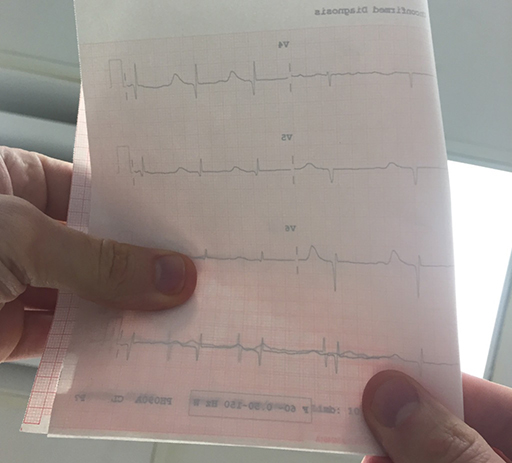
Then a delightful workaday practical example by Dr. Reuben Strayer, an emergency room expert: “How emergency room clinicians determine regular vs. irregular rhythm without instruments. Cardiologists use calipers. Intensivists write little marks on a page and march them across. Emergency providers fold the ECG in half and hold it up to the light. Or the sun.
Fold the tracing in half. Hold up to the light.
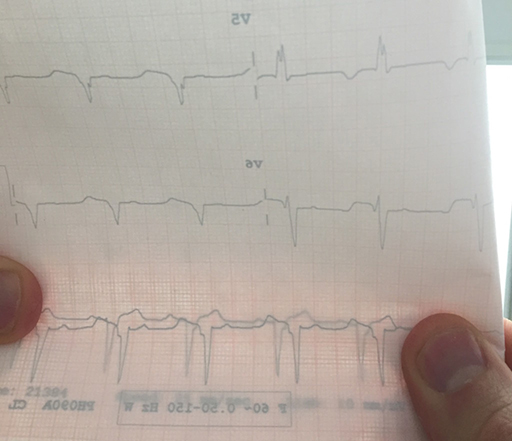
Now align the QRS complexes.
The rhythm is regular.
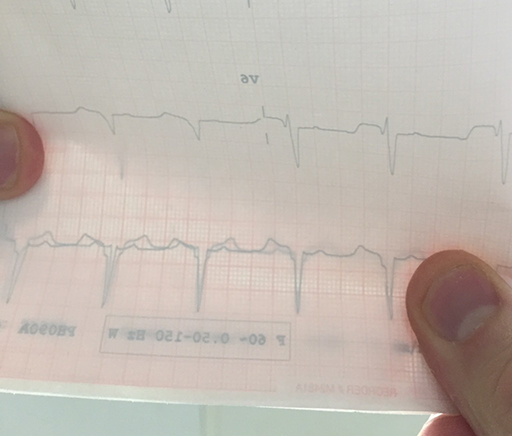
Here is another example.
Irregular.
Cannot line up QRS complexes.”

link: http://emupdates.com/2015/04/14/how-emergency-clinicians-determine-regular-vs-irregular/
