
One feature of note is the 'crows feet' at the right of a line to indicate that there is more than one data point on that line.
The printed article shows the 'fuzzy' lines as solid. It is obviously an artifact of the conversion to web format.
One feature of note is the 'crows feet' at the right of a line to indicate that there is more than one data point on that line.
The printed article shows the 'fuzzy' lines as solid. It is obviously an artifact of the conversion to web format.
Professor Tufte,
Nearly every time I go on the air, I worry that you will look at my work (like some PowerPoint presentation) and also say: "smarmy, chaotic, incoherent."
It's too much damned pressure having you in the neighborhood.
All the best,
Geoff Fox
There is an article on Wired by and about David Byrne's (of the Talking Heads) use of PowerPoint to artistic ends.
Very much in the tradition of artists subverting technology for their own purposes...
Nick Woolridge
The subject example concerns the computation of "Magic Knight's Tours". A Knight's Tour is a set of standard moves of a Knight piece on a chessboard, such that each square on the board is visited exactly once. Each square is numbered in the sequence of moves, so you have the numbers 1 through 64 on a standard 8x8 chess board. A Knight's Tour is called a Magic Knight's Tour if the resulting numbers on the squares form a magic square. It turns out there are 140 possible Magic Knight's Tours.
The most interesting graphic is one that shows all 140 combinations in a single graphic, enabling you to see the beginning and ending point of each tour, and to observe certain patterns in the tours.
A candidate for Beautiful Evidence?
Here is the beginning of a collection of rhetorical ploys in evidence presentations, verbal moves that replace real evidence.
FAUX CONSERVATISM This takes the form of "Our results are conservative; we made conservative assumptions about the model." The claim is that possible biases in assumptions work against the view advanced by the researcher. This is in fact an implicit error statement. Such claims are sometimes a rhetorical tactic that substitutes verbal fudge factors for quantitative assessments of error. See for example the Boeing/Columbia slide with the headline: Review of test data indicates conservatism for tile penetration
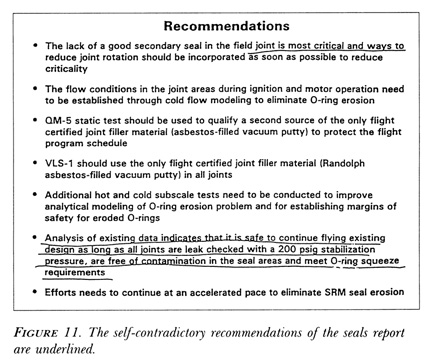
IGNORING SELF-CONTRADICTION See the Boeing slide. See also Richard Feynman's example in his Challenger report at page 137 of "What do you care what other people think?":
SIGNIFICANCE This is a pun on "statistical significance." Substantive significance is claimed as a result of statistical significance tests.
BIZARRE LEVELS OF STATISTICAL SIGNIFICANCE The null hypothesis is rejected at the .000000001 level and that extremeness is claimed as evidence for the researcher's alternative hypothesis. The "significance" level is largely a function of the ridiculousness of the null hypothesis, the (sometimes contrived) sample size, and the data results. In these calculations, the assumption of the independence of observations is often ignored, thereby inflating the probability level.
EDITORIAL ADVERBS PLACED IN FRONT OF NUMBERS Characterizing the data in advance of saying what the data are. Note the 2 uses of the word "only" in this news report: "Despite the costs, there is a limit to what the public will accept, according to the poll presented to the Harvard forum. Only 41 percent supported a special tax on junk food - an idea Sturm said would be difficult to administer - and only 37 percent said they strongly supported requiring restaurants to list calorie content on their menus." (Extra Pounds Cost Big Dollars: Rise In U.S. Obesity Labeled A Crisis, August 16, 2003, by John A. MacDonald) Note also the "only 37 percent said they strongly supported"; how many supported, strongly or not so strongly? How many strongly opposed?
Information comes from somewhere; say where. If you don't say where, then you are saying "Trust me," a phrase which by now has become ironic, and properly so. Documentation and sourcing are part of the fundamental quality control mechanism for the credibility of a presentation. One should be immediately skeptical of presentations that lack adequate sourcing or presentations that contain only tendentious or highly selected, cherry-picked sources. Evidence selection is the single biggest threat to the credibility of a report.
The Guardian has a very strong sentence concerning Prime Minister Tony Blair's claim that Iraq could deploy WMD's within 45 minutes (the "45 minute claim"): "In fact, the foundation for the government's claim was even shakier, according to the document: a single anonymous uncorroborated source quoting another single anonymous uncorroborated source."
Is the source's source a prisoner in Syria making up tidbits as fast as possible to avoid the torture of his children, or is the source's source a high-level official in Iraq? And then what about the source of the source? It makes all the difference. This is exactly why hearsay is dicey. Note the Guardian properly provides their source: "according to the document." The whole article revolves around the credibility of various sources, and it is worth reading by anyone who makes presentations.
I am in the process of developing a book on nuclear medicine imaging of the heart to accompany a course. Is there a good reference on book design?

Apparently it is common practice in the US Navy to provide the daily AM combat intelligence briefings via PowerPoint - prepared the night before by the intelligence watch officer. This practice is decried in the July Naval Institute Proceedings (Network Centric Warefare - MacKrell)as
a) tedious process and
b) difficult/impossible to keep current.
I cannot imagine a worse device to transmit combat intelligence given PowerPoint's low resolution and low bandwidth.
An account of current online prediction markets by Brendan I. Koerner at Slate.
So far the validation of such market predictions seems unsystematic, anecdotal, and based on economisting theology. It is difficult to figure out a good research design that would assess the quality predictive information deriving from such betting.
Would the same claims for predictive accuracy be made for betting on horse racing? The stock market? Insurance? Gambling? When does participation in predictive markets differ from lotto--a stupidity tax? How do we get good comparison predictions made by other methods? In the face of no other information, the average of all independent predictions should in the long-run do well. When is this the case? How well? Under what conditions? How to make quantitative estimates? Are betting pools like taking the average?
Does it matter who participates at what level of investment? What about dependencies among the choices of the participants? Purely strategic betting? How is the prediction affected by the framing of the betting question, as will surely be the case? Should some predictions receive more weight than others in the aggregation, just as higher quality studies receive more weight in meta-analysis? Size of bet does not seem to be a good proxy for how informed the bet is; indeed there might be an inverse relationship! Can knowledge of the prediction affect the predicted outcome, as is often the case in human affairs?
How about a market predicting the conclusions of studies of prediction markets--want to bet on the findings of studies from the University of Chicago School of Business compared to those from a Department of Sociology in France? Or classical vs. behavioral economists?
Prediction markets seem a bit like factor analysis or data mining in statistics--techniques to try when you don't have any good ideas.
