|
All 5 books, Edward Tufte paperback $180
All 5 clothbound books, autographed by ET $280
Visual Display of Quantitative Information
Envisioning Information
Visual Explanations
Beautiful Evidence
Seeing With Fresh Eyes
catalog + shopping cart
|
Edward Tufte e-books Immediate download to any computer: Visual and Statistical Thinking $5
The Cognitive Style of Powerpoint $5
Seeing Around + Feynman Diagrams $5
Data Analysis for Politics and Policy $9
catalog + shopping cart
New ET Book
Seeing with Fresh Eyes:
catalog + shopping cart
Meaning, Space, Data, Truth |
Analyzing/Presenting Data/Information All 5 books + 4-hour ET online video course, keyed to the 5 books. |


I need a 3-D image of a saddle, a hyperbolic paraboloid, the shape of which is defined by a rough scatter of data points lying on its surfaces. In turn the 3-D scatter should be projected on the 3 surrounding 2-dimensional planes making up the box around the saddle. Then the points lying in the 3 2-spaces should be projected to univariate sparklines, those sparklines folded to link the plane-pairs will also serve as the tripod axes of the 3-space.
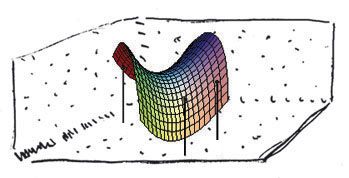 |
| (saddle surface made from a limited number of statistical data points, not smooth surfaces) |
The 3-D saddle (made from data points, not too many I hope) floats within this box.
The idea is that the 2-D and 1-D projections fail to provide sufficient information to identify the 3-D hyperbolic paraboloid! Note that our saddle is not a surface, it consists of just enough scattered data points over the surface to suggest a saddle shape. So this is not about mathematical surfaces but rather about data scatters.
Has this or similar been done and where can I pick up such an illustration? I recall an example of a 3-D letter made from dots surrounded by 3 2-D planes whose projected points from the 3-D object don't give away the 3-D shape.
Surely this has been done already in MacSpin or Statview or a similar 3-D data analysis tool. After all, this is the fundamental logic about why we should do multiviariate analysis. If necessary we can construct the sparkline axes.
Might a Kindly Contributor find a good example or perhaps construct one? This is for the sparkline chapter but I'd like also to slip in the idea about n-1 dimensional projections of data points not giving full information n-space data point activities, exactly the problem of A. Square living in Abbott's Flatland.
Thanks, ET
-- Edward Tufte
Response to Wanted for Beautiful Evidence: hyperbolic paraboloid made from a few scattered data points
Dr. Tufte,
I've made similar plots using Statistica. Can I send you an example? (I can't figure out how to attach a file to this, otherwise I would have included it.)
-- Andy Stevens
-- Andy Stevens (email)
Response to Wanted for Beautiful Evidence: hyperbolic paraboloid made from a few scattered data points
Dear Andy, Send it the Graphics Press email on the front page here, with a note saying what it is about and that I should see the attachment. It can also probably be shown on this board via HTML. Call Elaine Morse at Graphics Press for additional help if necessary. I look forward to seeing your work. Best, ET
-- Edward Tufte
Response to Wanted for Beautiful Evidence: hyperbolic paraboloid made from a few scattered data points
Some links:
http://www.math.umn.edu/~garrett/px/Saddle.html
http://www2.scc-fl.edu/lvosbury/CalculusIII_Folder/Calc%20III_exam3.htm
http://www.lionhrtpub.com/orms/orms-8-97/SoftwareReview.html
http://www.cs.appstate.edu/~jlh/snp/hh2004/hyperb.mov
http://en.wikipedia.org/wiki/Image:Quadric_Hyperbolic_Paraboloid.jpg
http://steiner.math.nthu.edu.tw/chuan/123/
-- David Cerruti (email)
Response to Wanted for Beautiful Evidence: hyperbolic paraboloid made from a few scattered data points
I will send you a pdf of the graphic that you requested to your email (couldn't work out how to attach it here). I can tweak the appearance if you like.
I wonder if the 3-D letter you mentioned was the G-E-B object shown on the cover of Douglas Hofstadter's classic "Godel, Escher, Bach: An Eternal Golden Braid" (see http://www.amazon.com/exec/obidos/tg/detail/-/0465026567/qid=1115268028/sr=8-1/ref=sr_8_xs_ap_i1_xgl14/002-5994802-2707265?v=glance&s=books&n=507846)
-- Drew Knight (email)
Response to Wanted for Beautiful Evidence: hyperbolic paraboloid made from a few scattered data points
Here's an attempt with my interpretation of sparklines on the axes:

I reduced the number of points to stop the sparklines appearing as solid black (at higher resolutions I could up the number).
-- Drew Knight (email)
Response to Wanted for Beautiful Evidence: hyperbolic paraboloid made from a few scattered data points
Here is my attempt:
http://www.nd.edu/~skandel/etc/hyperbolic_paraboloid.pdf
The resolution is low, and the walls of the box are "exploded" away from the three-dimensional data. The data set is random in x and y, and scattered normally around z. The x-z and y-z scatter plots still do show some of the "saddle", although they'd be hard to interpret on their own.
-- Alex Kandel (email)
Response to Wanted for Beautiful Evidence: hyperbolic paraboloid made from a few scattered data points
I am not in the office or I would send you one. I know there
are some excellent examples available for Mathematica from
their website and the output resolution is very good.
Try this one:
http://library.wolfram.com/infocenter/TechNotes/4128/
The images in Stephen Wolfram's book, "A New Kind of Science"
were produced in Mathematica and they look very crisp. Perhaps
someone else
could render Dr. Tufte's 3-D saddle or at least create
a high resolution base that could have the sparklines
added in Illustrator.
-- Tchad (email)
Response to Wanted for Beautiful Evidence: hyperbolic paraboloid made from a few scattered data points
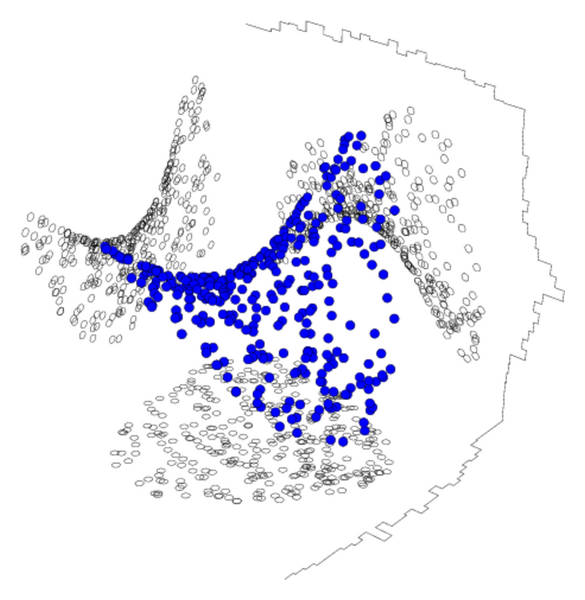
Another try, sans curve:
http://www.nd.edu/~skandel/etc/hp.jpg
698 data points are plotted. After playing with this for a little while, it seems difficult to get a clear functional form in the three-dimensional plot without producing highly structured x-z and y-z scatter plots; at least, it seems difficult with randomly generated data. "Stunt data" might produce a more convincing graphic.
-- Alex Kandel (email)
Response to Wanted for Beautiful Evidence: hyperbolic paraboloid made from a few scattered data points
Thank you so much Alex Kandel, this looks so good. We're going to play with the scaling and data points a bit.
-- Edward Tufte
Response to Wanted for Beautiful Evidence: hyperbolic paraboloid made from a few scattered data points
This has me thinking about galaxies and other astronomical objects - none of them, so far as I know, shaped like a saddle, but we see only one projection of each, so it's nice that there are so many that we can get a variety of projections to better understand the actual 3D form.
-- Carl Manaster (email)
Response to Wanted for Beautiful Evidence: hyperbolic paraboloid made from a few scattered data points
Sliding out on a tangent...
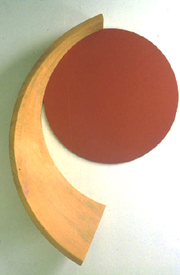
The artist Tony Delap has been using hyperbolic paraboloid shapes for a number of years. Here's an aluminum and wood dimensional painting of his, Tanagra, 1990. The red disk is painted sheet aluminum, about 24 inches in diameter, and lays flush against the wall; the lower point of the sweeping wooden section projects out from the wall a little over 7 inches, the upper point just a couple of inches.
 |
-- Steve Sprague (email)
Response to Wanted for Beautiful Evidence: hyperbolic paraboloid made from a few scattered data points
I found several examples from Statistica at:
http://www.statsoft.com/textbook/stexdes.html
There's a good one under the heading "Surface and contour plots"
-- Andy Stevens (email)
Response to Wanted for Beautiful Evidence: hyperbolic paraboloid made from a few scattered data points
Here a plot of 100 random points projected onto z = y^2 - x^2 made with IDL:

-- Michael Galloy (email)
Response to Wanted for Beautiful Evidence: hyperbolic paraboloid made from a few scattered data points
Thanks very much to everyone that contributed - we've decided to use the hyperbolic paraboloid that Alex Kandel created.
-- Edward Tufte
Response to Wanted for Beautiful Evidence: hyperbolic paraboloid made from a few scattered data points
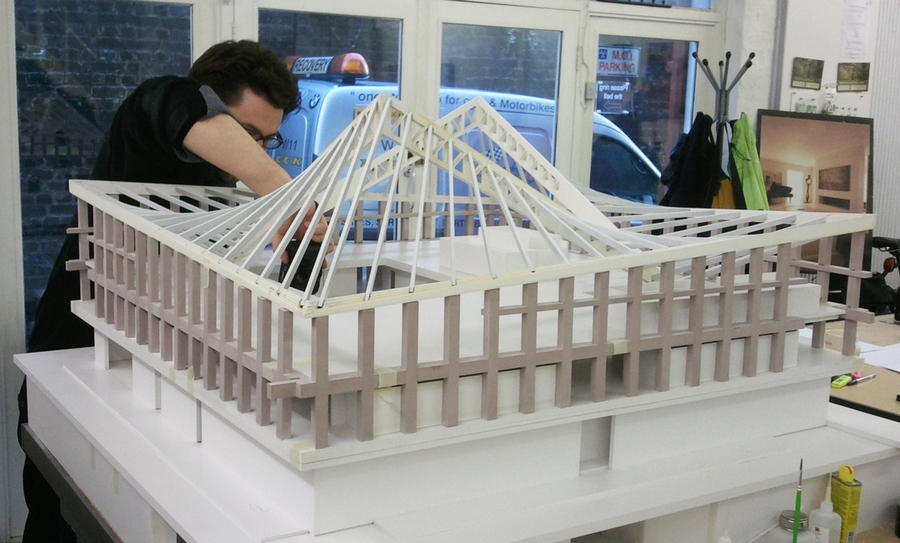
Here is a model maker in London creating a physical scale model of the hyperbolic paraboloid roof of the Commonwealth Institute.
http://newdesignmuseum.tumblr.com/post/15351144803/work-in-progress-at-network-model-makers- in
Best wishes
Matt
-- Matt R (email)
|
||||||