To provide the best experiences, we use technologies like cookies to store and/or access device information. Consenting to these technologies will allow us to process data such as browsing behavior or unique IDs on this site. Not consenting or withdrawing consent, may adversely affect certain features and functions.
The technical storage or access is strictly necessary for the legitimate purpose of enabling the use of a specific service explicitly requested by the subscriber or user, or for the sole purpose of carrying out the transmission of a communication over an electronic communications network.
The technical storage or access is necessary for the legitimate purpose of storing preferences that are not requested by the subscriber or user.
The technical storage or access that is used exclusively for statistical purposes.
The technical storage or access that is used exclusively for anonymous statistical purposes. Without a subpoena, voluntary compliance on the part of your Internet Service Provider, or additional records from a third party, information stored or retrieved for this purpose alone cannot usually be used to identify you.
The technical storage or access is required to create user profiles to send advertising, or to track the user on a website or across several websites for similar marketing purposes.

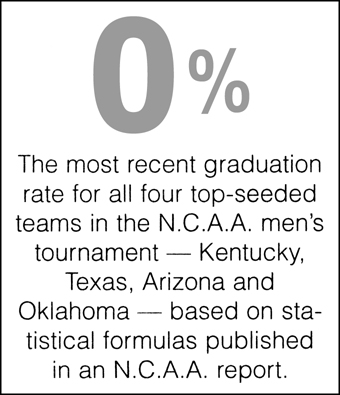



One-number semi-tables depend on having a vivid number that apparently is loaded with meaning, as in the well-known Harper’s Index http://harpers.org/harpers-index/listing.php3 The method provides a way to get a lot of quantitative data into journalism. It is also a way to provoke thought and to indicate the diversity of possibly relevant evidence.
These sorts of displays should almost always provoke the question “Isn’t it more complicated than that?” In their news report along with the above graphic, The Times helpfully published a big supertable about graduation rates for various sports and various college divisions, indicating the dismal graduation rates especially for men’s basketball (and the link between sports success and low graduation rates in those sports).
Such displays should always be accompanied by the source of the data, so we can find out how much more complicated it is. Harper’s provides the sources on a separate page in the magazine.
These tiny facts also, now and then, have an urban legend quality.
One way to have some estimation fun is to cover up the numbers and make a guess.
Dear Edward,
I thought you (and the other users of the forum) might be interested in The Independent’s front page graphic, which depicts the voting in a UN resolution to demand a ceasefire in the current Middle East conflict.
I think it is an excellent use of presenting evidence to make a simple yet powerful point.
Regards,
Rob
A “double number” (or twin single number) table (with supporting data) example is here;
http://www.global-cool.com/assets/SHslides/pages/003GC-PPT.htm